LPL Research is downgrading its 2021 U.S. GDP growth forecast from 6.25–6.75% to 5.75 6.25%. Growth is likely to come in at an annualized pace near 5% over the second half of the year. So, while expectations have been tempered, the recovery still has a lot of momentum, which is likely to extend well into 2022. In 2022 we may see economic growth exceed potential, creating a Z-shaped recovery— something we haven’t really seen since the early 1970s. What is a Z-shaped recovery and what might it mean for the Federal Reserve (Fed), inflation, and markets? We attempt to answer those questions below.
Early in the recovery, there was a lot of debate about what “shape” it would take. There were letters, such as V, U, W, L, and K, and shapes, such as a swoosh or a square root sign. The great recoveryshape debate has fizzled but still matters—for what’s ahead for the economy, for the still-raging inflation debate, for the policy debates taking place in Washington, and, of course, for the markets. And it turns out the debate centers on a recovery shape that wasn’t getting a whole lot of attention last summer: The Z-shaped recovery.
A STILL ROBUST RECOVERY HAS BEEN SLOWED BY THE DELTA VARIANT
The general shape of the recovery so far has been mainly driven by three forces: the COVID-19 pandemic, which provided a massive external shock to the economy that really had nothing to do with its natural cyclicality; historic fiscal and monetary stimulus put in place to get us through that shock and the rapid development of several effective vaccines. So far, these forces have given us a historically anomalous, deep V-shaped recovery: A steep drop and a surprisingly quick and robust recovery. The recovery has been quick enough that the U.S. actually topped the pre-recession peak in economic output last quarter, although we’re still likely below where we would have been right now if the pandemic hadn’t occurred.
The job market recovery has been slower. From 2011 to 2019, the economy created about 2.3 million jobs each year. Even 2019, the weakest year over that span, brought in more than 2 million jobs—a very strong number so deep into an expansion. Then in March and April 2020, the economy shed over 22 million jobs in just two months, with more than 20 million in April 2020 alone. We have regained just over 17 million of those jobs, but that still leaves us over 5 million short of the pre-pandemic peak.
The recovery has been slowed over the last several months by the spread of the highly contagious Delta variant and still sub-optimal vaccine rates. Behavioral changes in response to Delta, additional government restrictions, and strains on healthcare systems in regions with low vaccination rates have all taken their tolls, as has the impact of Delta on some East Asian trade partners, extending supply chain bottlenecks.
Consistent with our review of the potential impact of the Delta variant in our August 9, 2021, Weekly Market Commentary, we have seen the economy underperform expectations and are lowering our 2021 U.S. gross domestic product (GDP) growth forecast from 6.25–6.75% to 5.75–6.25%. The downward revision reflects expectations of growth slowing to around 5% annualized in the third and fourth quarters after coming in at about 6.5% in the first two quarters.
The slowdown from higher growth levels and recent data disappointments can make it easy to lose perspective on what those revised levels mean. For a sense of scale, the top three quarters of the last expansion were Q2 2014, Q3 2014, and Q4 2011, when the economy grew at an annualized rate of 5.2%, 4.7%, and 4.6% respectively. The prospective “disappointing” growth of the final two quarters of 2021 could still be near or above the peak growth level of the last expansion. In other words, despite the downward revision we believe the recovery still has a lot of momentum that we expect to extend well into 2022.
LOOKING AHEAD: TO Z OR NOT TO Z
A Z-shaped recovery is when the economy bounces back quickly and GDP jumps above its potential early in the recovery, before either settling back into the trend again, or potentially even falling back into recession—and we haven’t seen one in a long time. In [Figure 1], we see where the economy has been relative to its potential since the 1950s. Potential here is estimated by the non-partisan Congressional Budget Office (CBO), but it’s not something you can count. There are a lot of assumptions that go into views of economic potential and estimates do vary.
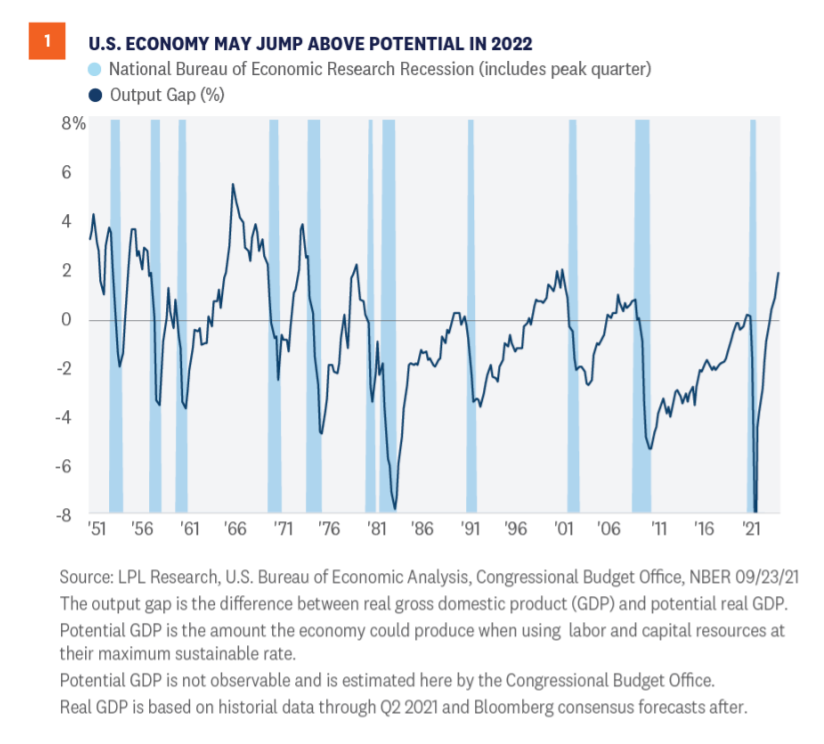
Looking at the chart, we see two somewhat-distinctive styles of recovery relative to potential. In the 1950s through the early 1970s, recoveries quickly pushed the economy up above potential, contributing to a shorter cycle of economic expansion and contraction. Since the 1970s, the economy has tended to run below potential for a longer period of time. For the second half of 2021 and 2022, we’ve added current consensus growth estimates by Bloomberg-surveyed economists and when you put the two together, you can see that current consensus estimates are for the economy to be in a Z-shaped recovery for the first time in decades. In fact, many of the on-going debates around the merits of additional fiscal stimulus, the risks from inflation, and when the Fed should start raising rates are fueled by assumptions on where the economy is relative to potential GDP, and what it means.
Potential GDP growth is the rate at which the economy can grow sustainably without overheating. When an economy is growing at full potential, it’s using most of its labor pool and industrial capacity. An economy can grow faster, but then it comes at a cost. The true rate of potential GDP growth is difficult to know in practice, but nevertheless where it is can be consequential. Growth above potential usually brings with it additional inflationary pressure. In addition, further stimulus, whether fiscal or monetary, comes with increased risk when the economy is growing above potential. Markets implicitly monitor potential GDP as well, as it helps determine the risk and outlook of current growth rates.
The main assumptions in estimating potential are the two basic components of GDP growth: The growth in hours worked, which basically reflects the growth in the work force and growth in productivity, the improvement in what the average worker produces in an hour. Right now, the CBO estimates that by the end of the decade, productivity at potential will grow about 1.4% a year and the labor force will grow about 0.3% a year, with a majority of that coming from population growth via immigration, since demographics are now limiting labor force growth from current population dynamics. Put those together and you get 1.7% potential real GDP growth. The CBO estimate is higher for the next couple of years at 2.1% due to post-recession adjustments.
Based on CBO estimates of potential GDP, consensus economic growth would take us above potential in 2022 and we haven’t seen such a fast move to that level in a long time. We do think interpreting the jump above potential is challenging, given the unusual cause of the recession. Still, if correct, it would probably mean that we should be cautious about an oversized stimulus package; that the Fed may find it more challenging to find the sweet spot for withdrawing stimulus; that inflation may be stickier than expected, although it’s likely to continue to settle down; and that market gains may be more muted next year. But looking at the type of shock the economy was hit with, if we get a Z-shaped recovery, we don’t think it implies the type of short cycle we saw in the 1950s. It also likely points to stagflation being off the table. The inflation risk may be there, but the economy isn’t stagnating. It’s booming. The risk isn’t stagflation—it’s too much of a good thing.
BACK TO BUSINESS
The downward revision of our 2021 GDP growth forecast is consequential but context remains important. Widespread vaccination distribution has helped extend the V-shaped recovery seen to date—even with the added threat from the Delta variant—and has supported the handoff from stimulus bridging a pandemic driven income shortfall back to workforce growth supporting rising incomes. The economic recovery has been slowed but continues to exhibit strong momentum. As we look into 2022, we think the key concern is not the shortfall in the economic recovery but making sure the transition back to the private economy leading the recovery is supported—but not unnecessarily fueled.
Click here to download a PDF of this report.
IMPORTANT DISCLOSURES
This material is for general information only and is not intended to provide specific advice or recommendations for any individual. There is no assurance that the views or strategies discussed are suitable for all investors or will yield positive outcomes. Investing involves risks including possible loss of principal. Any economic forecasts set forth may not develop as predicted and are subject to change.
References to markets, asset classes, and sectors are generally regarding the corresponding market index. Indexes are unmanaged statistical composites and cannot be invested into directly. Index performance is not indicative of the performance of any investment and do not reflect fees, expenses, or sales charges. All performance referenced is historical and is no guarantee of future results.
Any company names noted herein are for educational purposes only and not an indication of trading intent or a solicitation of their products or services. LPL Financial doesn’t provide research on individual equities.
All information is believed to be from reliable sources; however, LPL Financial makes no representation as to its completeness or accuracy.
US Treasuries may be considered “safe haven” investments but do carry some degree of risk including interest rate, credit, and market risk. Bonds are subject to market and interest rate risk if sold prior to maturity. Bond values will decline as interest rates rise and bonds are subject to availability and change in price.
The Standard & Poor’s 500 Index (S&P500) is a capitalization-weighted index of 500 stocks designed to measure performance of the broad domestic economy through changes in the aggregate market value of 500 stocks representing all major industries.
The PE ratio (price-to-earnings ratio) is a measure of the price paid for a share relative to the annual net income or profit earned by the firm per share. It is a financial ratio used for valuation: a higher PE ratio means that investors are paying more for each unit of net income, so the stock is more expensive compared to one with lower PE ratio.
Earnings per share (EPS) is the portion of a company’s profit allocated to each outstanding share of common stock. EPS serves as an indicator of a company’s profitability. Earnings per share is generally considered to be the single most important variable in determining a share’s price. It is also a major component used to calculate the price-to-earnings valuation ratio.
All index data from FactSet.
This research material has been prepared by LPL Financial LLC.
Securities and advisory services offered through LPL Financial (LPL), a registered investment advisor and broker-dealer (member FINRA/SIPC). Insurance products are offered through LPL or its licensed affiliates. To the extent you are receiving investment advice from a separately registered independent investment advisor that is not an LPL affiliate, please note LPL makes no representation with respect to such entity.
Not Insured by FDIC/NCUA or Any Other Government Agency | Not Bank/Credit Union Guaranteed | Not Bank/Credit Union Deposits or Obligations | May Lose Value
RES-901600-0921 | For Public Use | Tracking #1-05194890 (Exp. 09/22)